FIGURE 8.

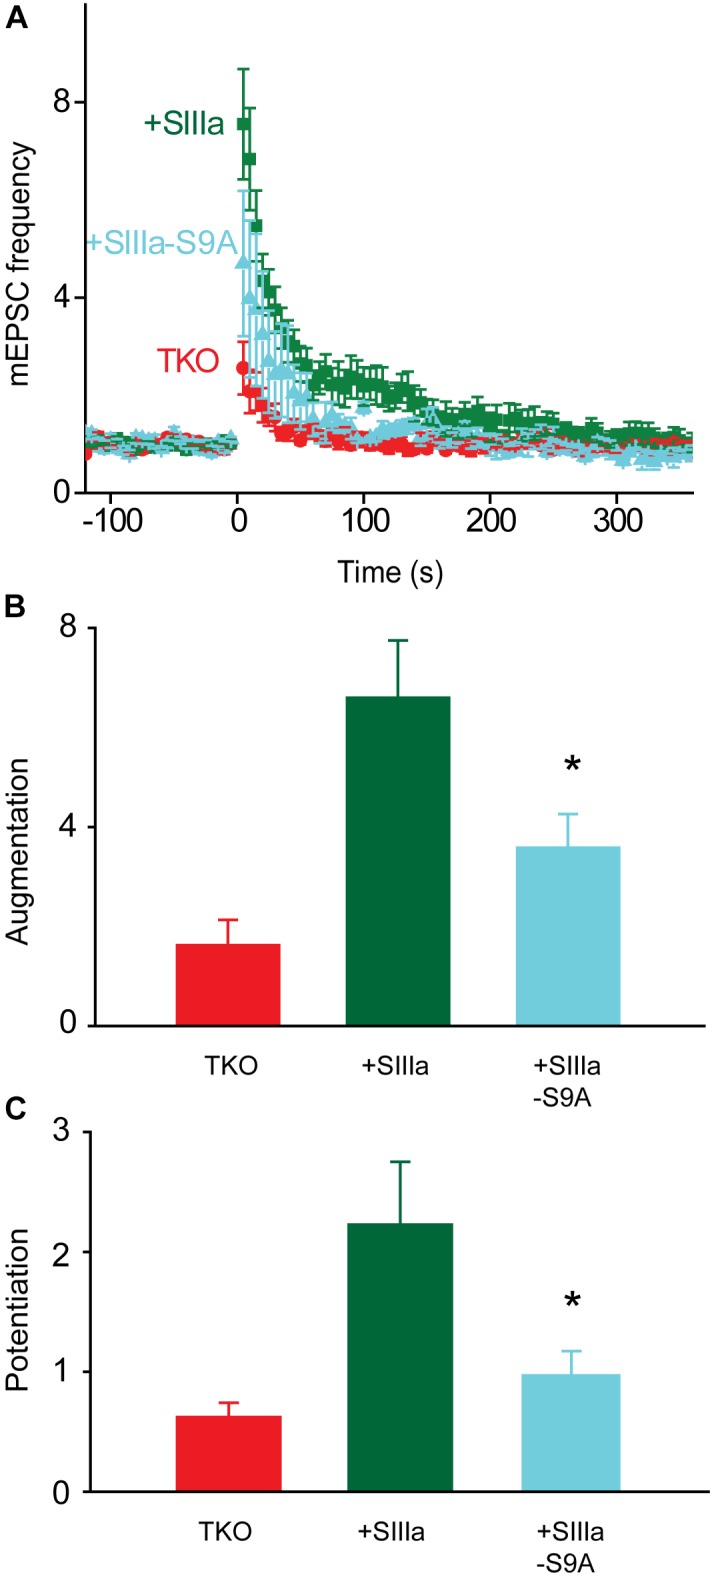
PKA regulation of synapsin IIIa rescue of TKO phenotype. (A) Time course of changes in mEPSC frequency produced by electrical activity (50 Hz, 2 s stimulation) in TKO neurons (red) and in TKO neurons expressing wild-type synapsin IIIa (+SIIIa; green) or phosphorylation-deficient synapsin IIIa S9A (+SIIIa-S9A; cyan). Points indicate mean values of mEPSC frequency (n = 5), normalized to baseline values measured prior to the stimulus train, and error bars indicate ±SEM. (B) Peak amount of augmentation of mEPSC frequency, calculated from exponential fits to the data in panel (A), in TKO neurons (red) and in TKO neurons expressing wild-type synapsin IIIa (green) or phosphorylation-deficient synapsin IIIa S9A (cyan). Values in panels (B,C) indicate means and error bars indicate ± SEM, while asterisks indicate significant differences compared to TKO + SynIIIa neurons.
