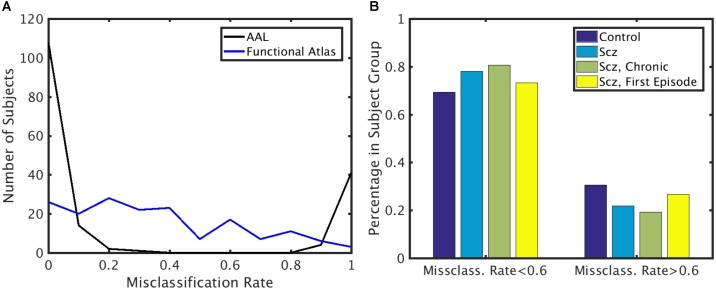
FIGURE 6.
Misclassification rate. (A) Distribution of misclassification rate across subjects for the AAL and functional atlases. (B) Percentage of subjects in each subject group with low and high misclassification rate using the AAL atlas. X-axis: Subjects that are highly classifiable (misclassification rate < 0.6) and unclassifiable (misclassification rate > 0.6). Y-axis: Percentage of subjects in each subject group.

