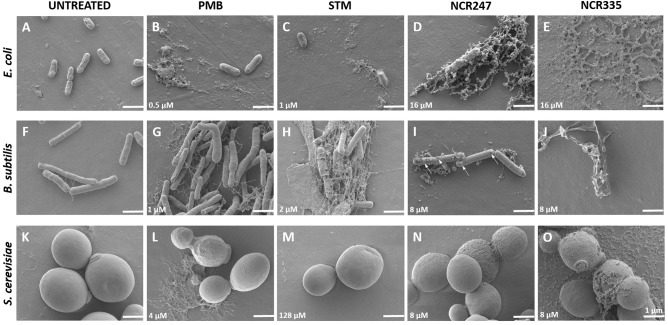
FIGURE 1.
Morphology of control (untreated) and peptide/antibiotics treated E. coli, B. subtilis and S. cerevisiae at MICs observed with Scanning Electron Microscopy. All treatments were made in LSM at minimal inhibitory concentration (MIC) shown in the lower left corner of each panel. The arrows (panel I) indicate the observed blebs and blisters. Scale bar: 1 micron.

