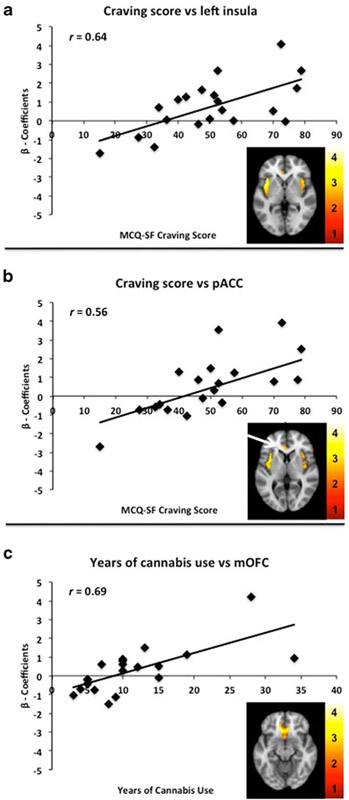
Fig. 3.

Correlations between brain responses during backward-masked cannabis cues and cannabis craving or years of cannabis use. Scatterplots showing significant correlations between MCQ-SF craving scores and β coefficients extracted from the cluster and averaged. Illustrated are statistical maps in the axial view: a Cannabis craving versus left insula, x = −40; b cannabis craving versus perigenual anterior cingulate cortex (pgACC), x = −4; and c years of cannabis use versus medial orbitofrontal cortex (mOFC), x = 8. Data are displayed neurologically (left is left). The color scale represents the T values. An interactive visual display of unmasked brain data in all three planes at p =0.01 can be found at http://franklinbrainimaging.com
