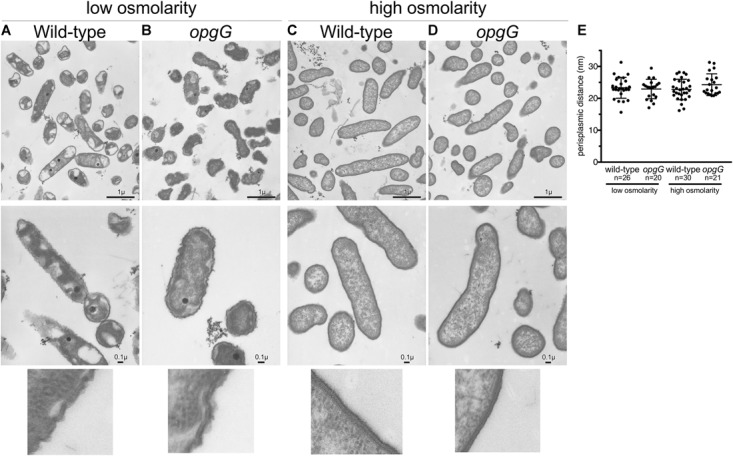
FIGURE 7.

Transmission electron microscopy images of wild-type (A,C) and opgG mutant (B,D) at low osmolarity (A,B) and high osmolarity (C,D). Images show similar architecture for both strains when grown in the same medium but differences when osmolarity is varied. (E) Periplasm size (nm) from TEM images.
