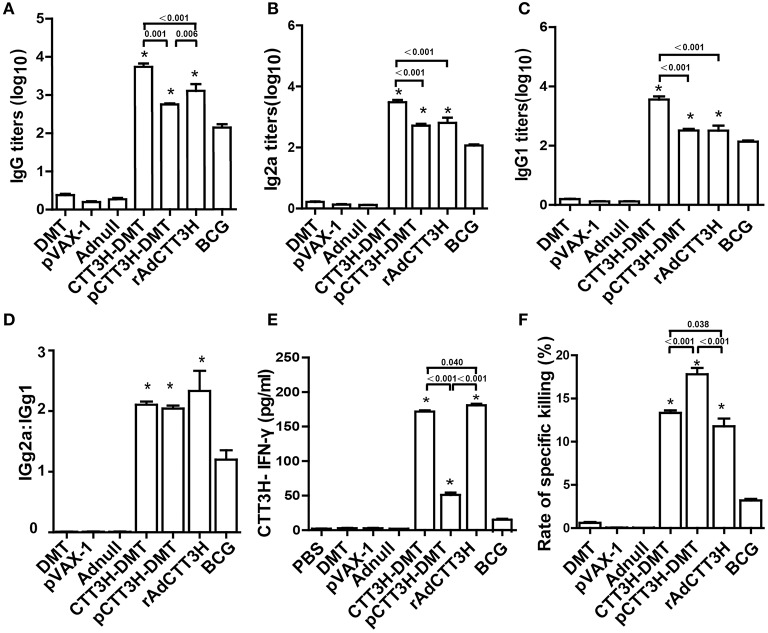
Figure 3.
Comparison of CTT3H-specific Th1 responses among three CTT3H-based vaccines immunized C57BL/6 mice (n = 6). The immunization schedule was described in Figure 2A. At the tenth week after immunization, sera from each C57BL/6 mice of different groups were collected and titers of anti-CTT3H antibodies IgG (A), IgG2a (B), and IgG1 (C) were detected by ELISA. The results are shown as (mean ± SEM) log10 endpoint titers. (D) The ratio of IgG2a/IgG1 of different vaccinated groups. (E) The levels of CTT3H-specific IFN-γ secreted by splenocytes. The concentration of IFN-γ in supernatants was detected by ELISA and the results are expressed as mean ± SD (pg/mL). (F) Comparison of CTL response to TB10.4 among different vaccinated groups (mean ± SEM). *p < 0.05 vs. the BCG group. All experiments were repeated twice with similar results.

