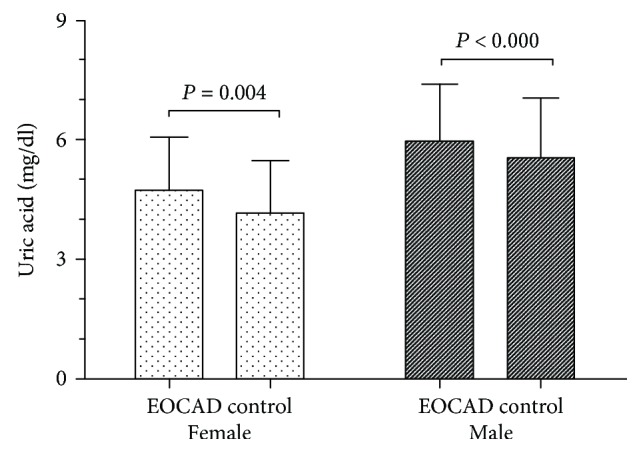
Figure 3.

Comparing serum uric acid levels in EOCAD and control group by gender. Serum uric acid levels in the male and female group. Serum uric acid levels were significantly higher in the female EOCAD group (4.718 ± 1.343 mg/dl) than in the female control group (4.178 ± 1.311 mg/dl, unpaired t- test, P = 0.004). The same relationship was also detected in male EOCAD (5.965 ± 1.442 mg/dl) and male control group (5.560 ± 1.492 mg/dl, unpaired t- test, P < 0.001).
