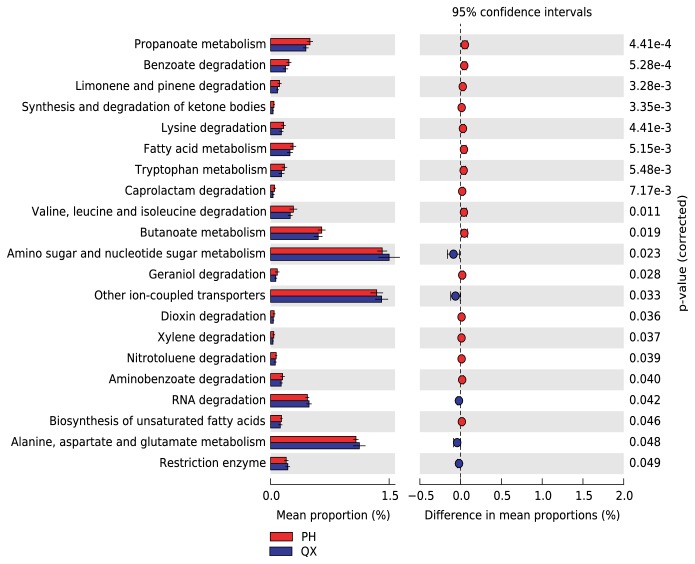
Figure 6.
PICRUSt shows that the 21 predicted KOs significantly differ in their distribution in healthy QX (blue) and PH (red) populations. Functional modules involved in amino and nucleotide sugar metabolism and in RNA degradation are more abundant in QX than they are in PH. P < 0.05, Welch's t-test, Welch's inverted CI method, and effect size > 0.01.

