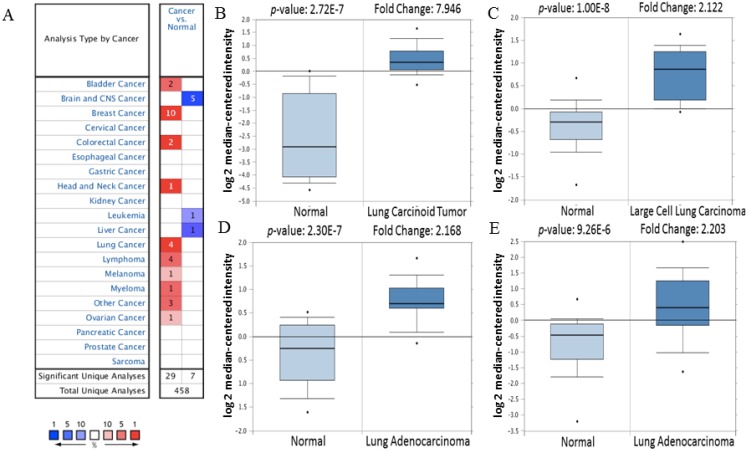
Figure 1.
The transcription level of CDK5 in various cancer types (Oncomine Database). (A) The left column in red showed the number of datasets with CDK5 overexpression and the right column in blue show the under expression datasets number after compared clinical specimen of cancer vs. normal tissue. The box plot comparing specific CDK5 expression in normal (left plot) and cancer tissue (right plot) was derived from Oncomine database. The analysis was shown in (B) lung carcinoid tumor, (C) large cell lung carcinoma, (D, E) lung adenocarcinoma relative to normal lung. The threshold set as follow: p-value: 1E-4, fold change: 2, gene rank: 10%.

