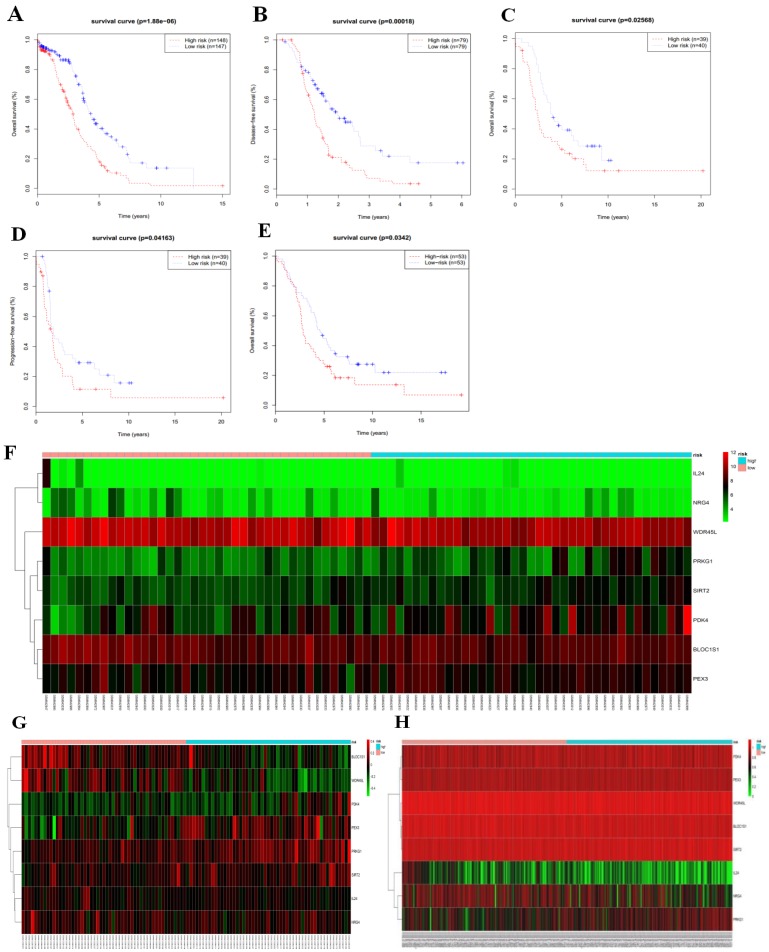
Figure 5.
Based on median risk score, the eight-gene risk signature divided patients into high-risk and low-risk groups with distinct prognosis in the TCGA RNAseq cohort (a-b), GSE26193 cohort (c-d), and GSE51088 cohort (e); (f-h) Hierarchical clustering of high-risk and low-risk patients expressing the eight genes in GSE26193 (f), GSE51088 (g), and TCGA RNAseq (h). Red indicates higher expression and green indicates lower expression.

