Figure 6.
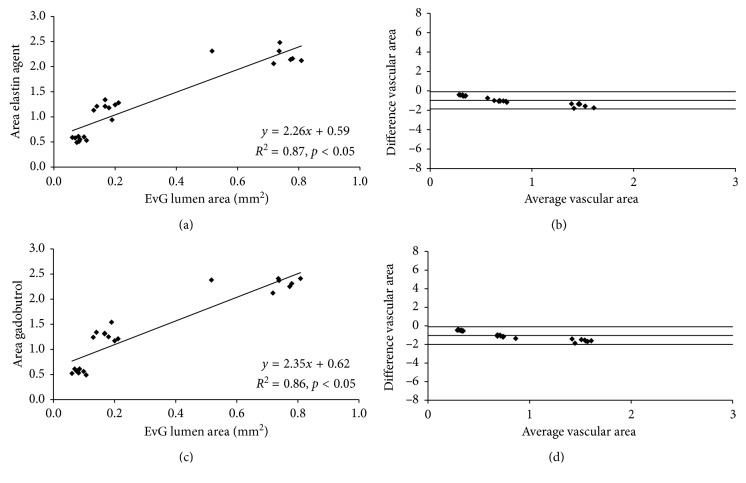
Correlation of in vivo aortic area measurements following the administration of the probes and the ex vivo measurements on the Elastica van Giesson stain. (a) In vivo area measurements following the administration of the elastin-specific molecular probe showed a close correlation with the ex vivo measurements on the Elastica van Giesson stain (n=4). Measurements were performed on the high-resolution 3D angiography (flash). (b) Bland-Altman analysis only shows a minor difference between the two measurements with relatively small confidence intervals. (c) In vivo area measurements following the administration of gadobutrol showed a close correlation with the ex vivo measurements on the Elastica van Giesson stain (n=4). (d) Bland-Altman analysis only shows a minor difference between the two measurements with relatively small confidence intervals. EvG: Elastica van Giesson stain.

