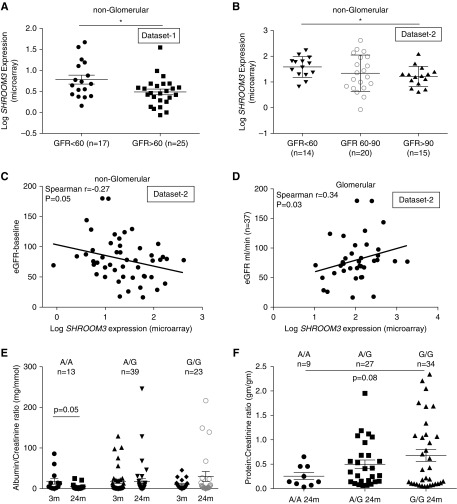
Figure 1.
Glomerular versus nonglomerular SHROOM3 expression and rs17319721 have dichotomous associations with eGFR and albuminuria in humans. Dot graphs plot SHROOM3 expression (log SHROOM3 expression by microarray) in nonglomerular fraction of (A) dataset 123 and (B) dataset 224 (glomerular and nonglomerular transcriptome) of renal biopsy samples plotted against eGFR (ml/min). Figure shows the correlation lines between eGFR (ml/min) and (C) nonglomerular and (D) glomerular SHROOM3 expression in dataset 2 (Spearman R=−0.27 and 0.35; P=0.05 and 0.03, respectively). (E) Dot plots show serial mean ACR (mg/mmol) at 3 and 24 months in GoCAR Sydney cohort displayed by donor SNP type (paired t-test P=0.05 between 3- and 24-month A/A donors). (F) Dot plots show mean protein-to-creatinine ratios (mg/gm) at 24 month cross-sectionally by donor SNP type (unpaired t test A/A versus G/G =0.08). Dot plots/whiskers=mean/SEM; *P<0.05.

