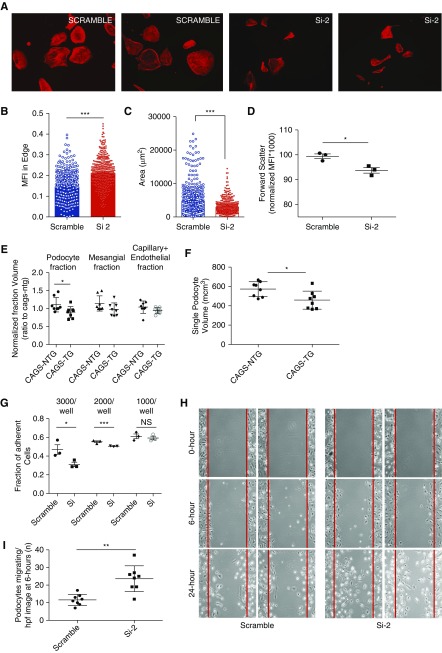
Figure 5.
SHROOM3 knockdown alters podocyte actin cytoskeletal organization, morphology, adhesion and migration. (A) Right to left: representative immunofluorescence images (20×) of phalloidin F-actin cytoskeletal stain of Scramble versus Si-2 podocyte cell lines (labeled). Dot plots summarize (B) ACTIN bundle intensity at cellular margins and (C) cell area of phalloidin-stained podocytes (n=4 experiments; 150 cells per experiment). (D) Dot plots show mean flow cytometric forward scatter (size) of trypsinized cell suspensions of podocytes normalized to Scramble podocytes (n=3 experiments; see Supplemental Figure 5, A and B). (E) Graph compares glomerular component volumes (podocyte, mesangial, and capillary+endothelial fractions), and (F) average single podocyte volume, between CAGS-NTG and CAGS-TG mice (n=8 mice; 6 weeks DOX). (G) Scramble and Si-2 podocyte cell lines were differentiated and plated on laminin-coated 96-well plates at 1000, 2000, and 3000 cells/well densities (n=3 sets for each density). Bar graphs compare proportion of adherent podocytes: total podocytes in each plating density at 1 hour by turbidimetry (crystal violet method). (H) Differentiated Scramble and Si-2 podocytes were plated in 10-cm dishes. Scratches were made on fully confluent plates using sterile pipette tips. Panels show representative phase-contrast images (4×) of Scramble and Si-2 conditions at 0, 6, and 24 hours. (I) Line dot graphs compare number of cells inside scratch margins of eight streaks in duplicate plates at 6 hours (line dot graphs/whiskers=mean/SD; *unpaired t test P<0.05; **P<0.01; ***P<0.001.

