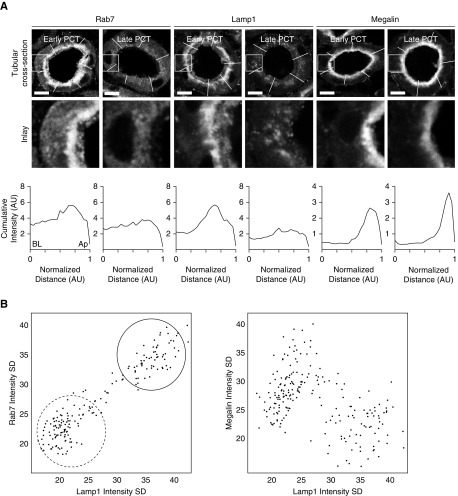
Figure 2.
Expression patterns of endolysosomal proteins within cells differ between early and late segments of the proximal tubule. (A) Analysis of signal intensity across PCTs cut in cross-section revealed that expression of the endolysosomal proteins Rab7 and Lamp1 was concentrated predominantly in the subapical region of cells in early segments, but was relatively uniform across cells in later segments. In contrast, megalin was expressed in the apical brush border region of all PCT segments. Scale bars, 10 μm. The plots (bottom panels) depict the cumulative intensity profiles for the segments drawn in the top panels. The segments have different lengths and were therefore normalized to arbitrary units (AU), with 0 being the baso-lateral side of the cell (BL), and 1 the apex (Ap). (B) The SD of the Lamp1 signal within regions of interest drawn around sections of PCTs correlated closely with that of Rab7 (R=0.93; P<0.001), and two distinct clusters were observed, corresponding to early (solid line) and late (dashed line) segments, respectively. In contrast, no positive correlation was observed between the SD of the Lamp1 and megalin signals (R=−0.47; P<0.001).

