Figure 5.
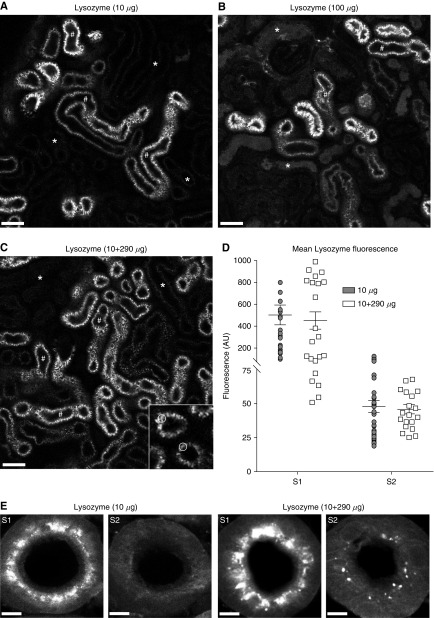
The S1 segment of the proximal tubule has a very high capacity for protein uptake. (A–D) Intravital imaging of lysozyme uptake in the PCT in vivo. (A) After intravenous injection of 10 µg of fluorescently labeled lysozyme, uptake was only observed in S1 segments (#). (B) Uptake remained predominantly in S1 (#) after a 10× higher injection. At this dose some luminal wasting was observed, but uptake in S2 PCT cells (*) remained low. (C and D) At an even higher dose of lysozyme (10 µg labeled+290 µg unlabeled), uptake patterns in S1 (#) and S2 (*) were similar to the 10-µg injection. Data depicted are mean fluorescence intensities within regions of interest in the apical vesicles of PCT cells (insert in (C)). The intensity values in S2 segments predominantly reflect nonspecific background fluorescence signals. AU, arbitrary units. (E) High-resolution confocal microscopy of fixed kidney specimens 1 hour post injection of lysozyme confirmed that uptake was predominantly confined to S1, with only a small level of uptake detectable in S2 at 300 µg. Scale bars, 50 µm in (A–C), and 5 µm in (E).

