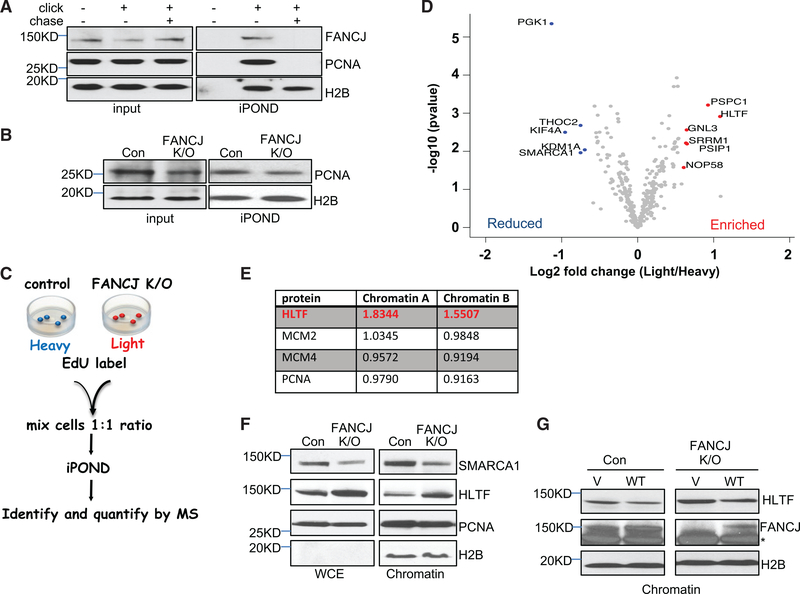
Figure 2. Isolation of Proteins on Nascent DNA (iPOND) from FANCJ-KO and Control 293T Cells.
(A) Western blot analysis with the indicated Abs of input or iPOND samples following non-click, click, or thymidine chase from 293T cells.
(B) Western blot analysis with indicated Abs of input or iPOND samples from control and FANCJ-KO 293T cells.
(C) Schematic representation of the SILAC iPOND technique.
(D) Volcano plots of the p values versus the log2 protein abundance differences between purified replisomes of 293T control (heavy) and FANCJ-KO (light) cells. Significantly enriched and reduced proteins are highlighted in red and blue, respectively. p values are calculated from the data of three biological repeats.
(E) Table shows the light/heavy ratio in chromatin fractions for indicated proteins.
(F) Western blot analysis with the indicated Abs of WCE and chromatin preparations from 293T cells.
(G) Western blot analysis with the indicated Abs of cells transfected with vector (V) or wild-type FANCJ (WT) 293T cells. Asterisk indicates nonspecific band.

