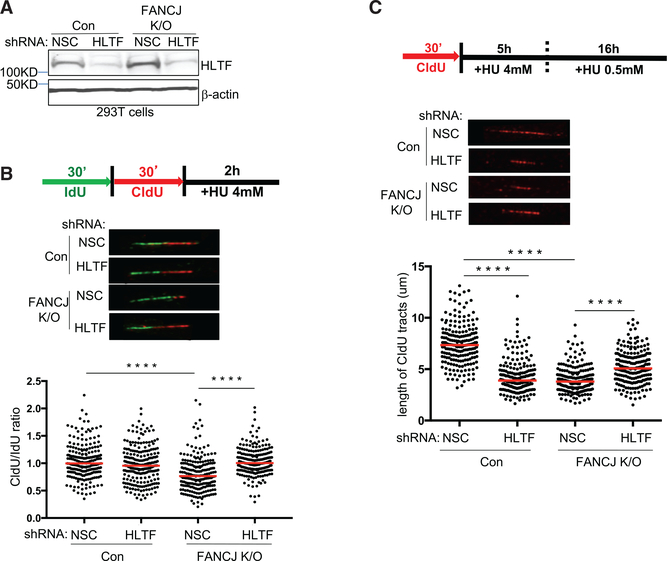
Figure 3. HLTF Contributes to Fork Degradation in FANCJ-KO Cells, and FANCJ Contributes to Fork Degradation in HLTF-Depleted Cells following Prolonged Stress.
(A) Western blot analysis with the indicated Abs of lysates from control and FANCJ-KO 293T cells expressing shRNA against HLTF or NSC.
(B) Schematic, representative images, and quantification of the CldU/IdU ratio after HU treatment. (C) Schematic, representative images, and quantification of the CIdU tract length.
Each dot represents one fiber; at least 200 fibers are quantified from two independent experiments. Red bars represent the median. Statistical analysis according to two-tailed Mann-Whitney test; ****p < 0.0001.

