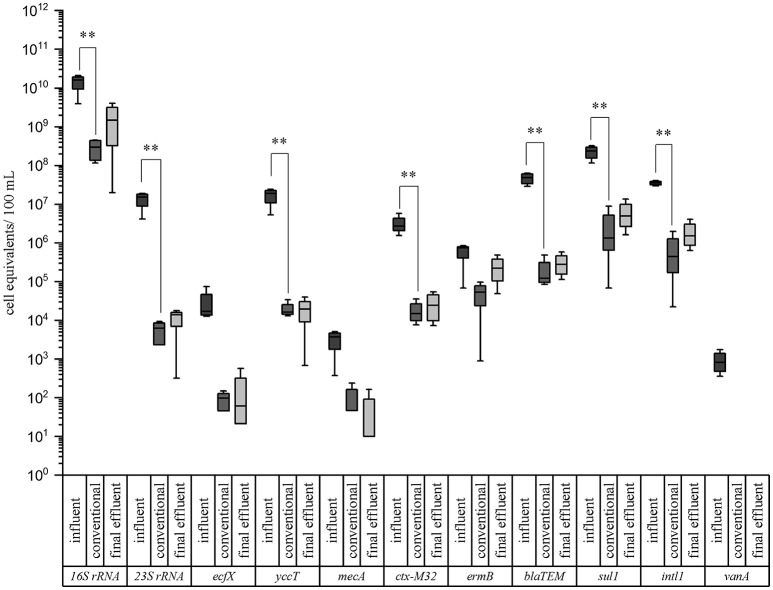
Figure 2.
Box plot graphs of the qPCR analyses targeting taxonomic and antibiotic resistance gene markers in wastewater samples of a municipal WWTP. Data are given for the influent, conventional (activated sludge with sedimentation), and effluent samples. Median values, standard deviations, and minimum/maximum values from 4 sampling periods are given. Significance is given by t-test calculation and is shown by asterisks (t-test; **p < 0.05, *p < 0.1).

