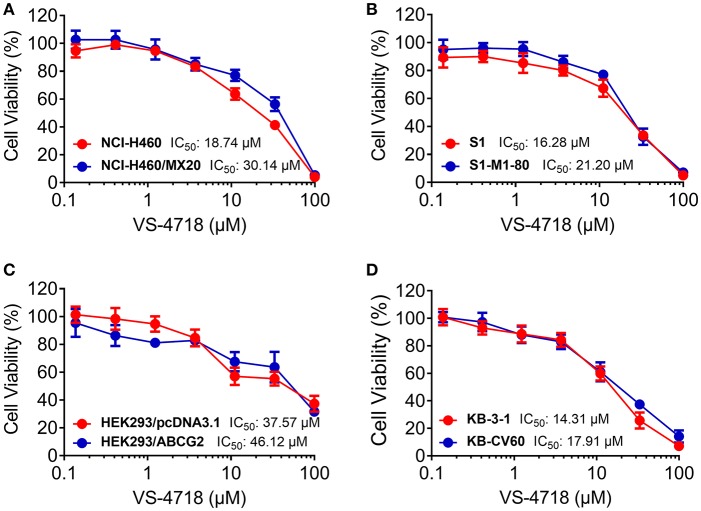
Figure 2.
Concentration-viability curves for parental and ABCG2- and ABCC1-overexpressing cells incubated with VS-4718. (A) Concentration-viability curves for NCI-H460 and NCI-H460/MX20 cells incubated with VS-4718 for 72 h. (B) Concentration-viability curves for S1 and S1-M1-80 cells incubated with VS-4718 for 72 h. (C) Concentration-viability curves for HEK293/pcDNA3.1 and HEK293/ABCG2 cells incubated with VS-4718 for 72 h. (D) Concentration-viability curves for KB-3-1 and KB-CV60 cells incubated with VS-4718 for 72 h. The cell viability was determined by MTT assay. Data are expressed as mean ±SD, representative of three independent experiments in triplicate.

