Fig. 1.

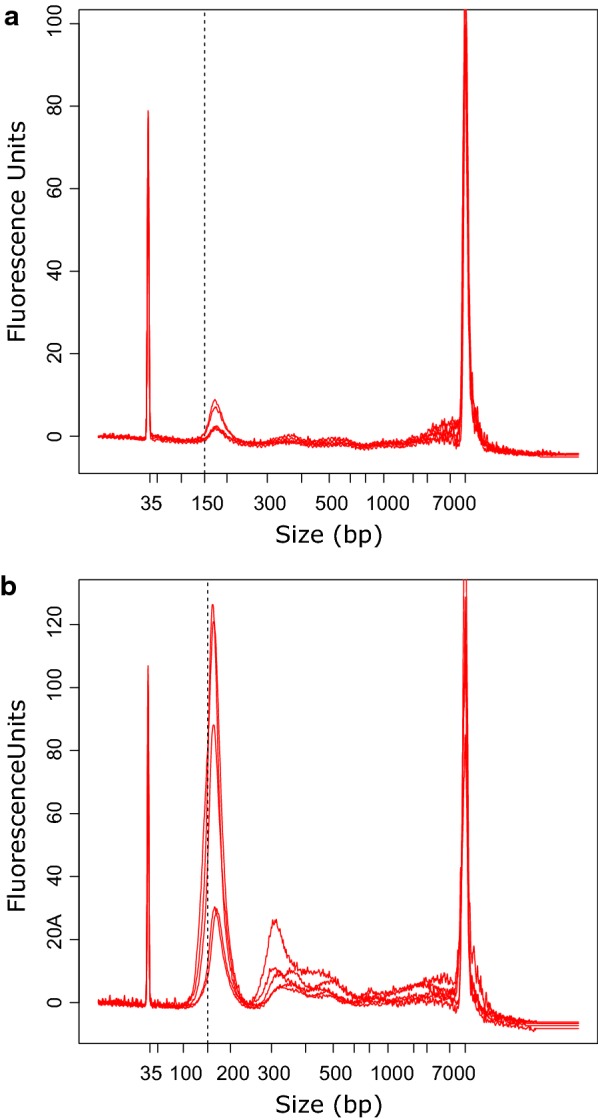
Distribution of cfDNA fragment size and cfDNA level in plasma. a cfDNA from healthy controls (n = 10) displayed larger fragment size (X-axis) and lower cfDNA level (Y-axis) compared to b cfDNA from patients with pancreatic cancer (n = 10). The dotted line placed at 150 bp indicates a shift towards shorter fragment size in patient samples
