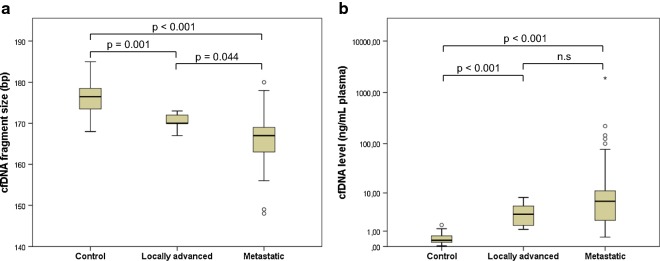
Fig. 2.
Distributions of cfDNA fragment size and cfDNA levels in patient and control samples. Boxplot shows differences in a cfDNA fragment size and b cfDNA levels between samples from healthy controls (n = 28), patients with localized disease (n = 6), and patients with metastatic disease (n = 55). Abbreviation: n.s, not significant

