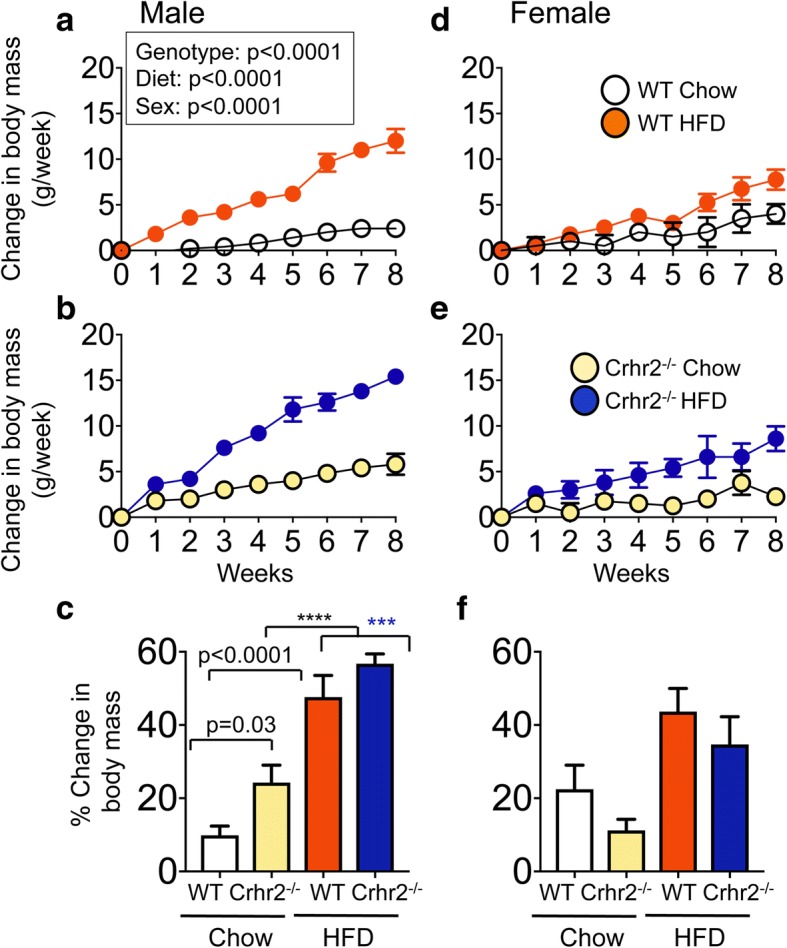
Fig. 1.

Crhr2−/− male mice gain more body mass. Line graphs showing weekly change in body mass in a, b male (n = 9/group) and d, e female (n = 9/group) WT and Crhr2 null mice on chow and HFD. Data is presented as change in body mass per week compared to baseline. c, f Bar graphs showing percent (%) change in body mass for chow- or HFD-fed mice. Three-way ANOVA and post hoc Tukey’s multiple comparisons. ****p < 0.0001, Crhr2−/− male mice chow vs. HFD and ***p = 0.0005, WT male HFD vs. Crhr2−/− male HFD
