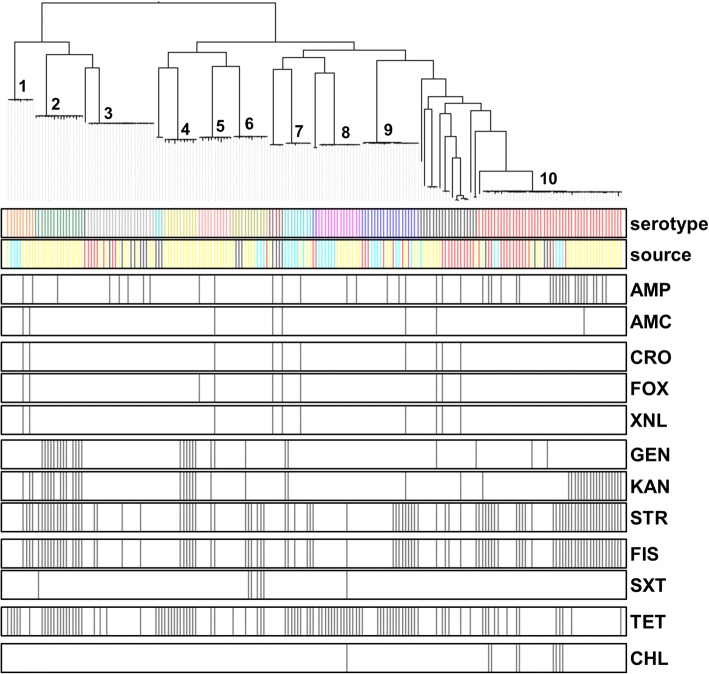
Fig. 6.
Distribution of phenotypic antimicrobial resistance in the genomes of the 200 S. enterica isolates included in this study. The isolates were clustered based on core genome SNPs using ParSNP, and the antimicrobial resistances are shown by black lines in the respective bars below. Antimicrobials used are grouped according to their class and mechanism: penicillins (AMP, ampicillin; AMC, amoxicillin and clavulanate [augmentin, AUG]); cephalosporins (CRO, ceftriaxone (AXO); FOX, cefoxitin; XNL, ceftiofur); aminoglycosides (GEN, gentamicin; KAN, kanamycin; STR, streptomycin); sulfanomides/folate inhibitors (FIS, sulfisoxazole; SXT, trimetroprim and sulfamethoxazole); tetracycline (TET) and chloramphenicol (CHL). For source, these were subdivided into four major classes: environment (yellow), human clinical (red), chicken (dark blue) and swine (light blue). Major serovars are indicated by numbers: 1. Johannesburg; 2. Muenster; 3. Schwarzengrund; 4. Worthington; 5. Altona; 6. Mbandaka; 7. Senftenberg; 8. Rissen; 9. Derby; 10. Typimurium and 4,[5],12:i:-. Full details of source can be found in Additional file 2: Table S1

