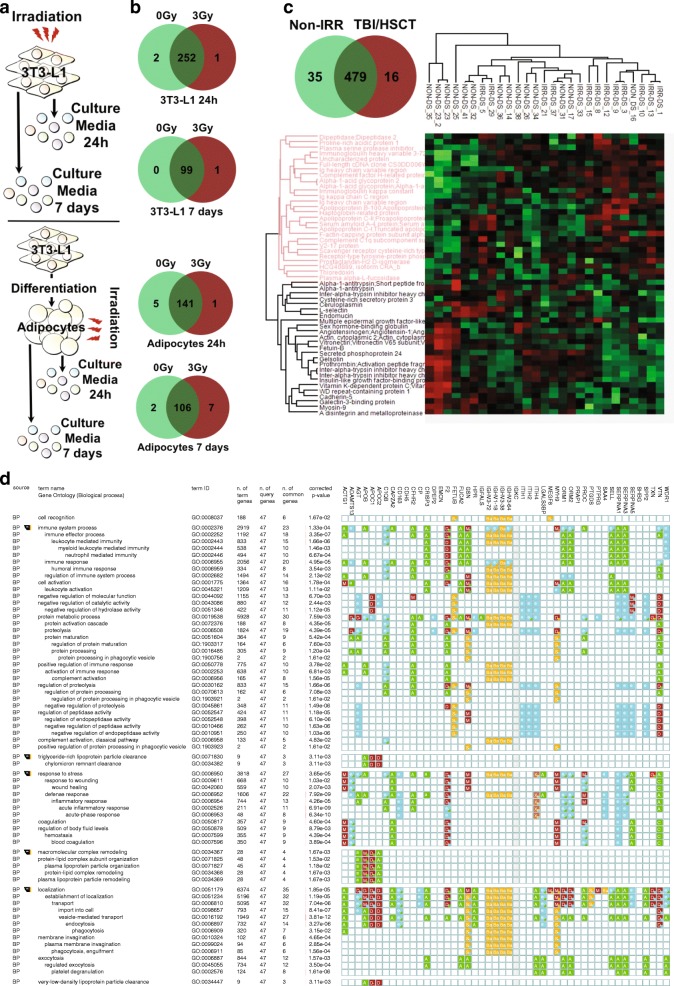
Fig. 4.
Circulating factors involved on the indirect effect of irradiation on T cell function a. Schematic representation of the in vitro model to identify circulating factors responsible for the indirect effect of irradiation on T cell function. b. Venn diagram representing uniquely identified proteins in culture media from non-irradiated cells (0Gy, light green), from irradiated cells (3Gy, red), or in both conditions (dark green), in four different conditions (undifferentiated and differentiated fibroblasts at 24 h and seven days post-irradiation). c. Venn diagram representing uniquely identified proteins in plasma from non-irradiated (non-IRR, light green) or TBI/HSCT-treated survivors (TBI/HSCT, red), or found in both groups (dark green). Unsupervised hierarchical cluster analysis of protein abundance identifying specific patterns of proteins abundance profile in the two groups of survivors. d. Gene ontology analysis performed on proteins showing a different pattern of abundance between the two groups of survivors. S: Sequence or structural similarity [ISS]; Ba: biological aspect of ancestor [IBA]; A: traceable author [TAS]; e: electronic annotation [IEA]; D: direct assay [IDA]; M: mutant phenotype [IMP]; G: genetic interaction [IGI]; a: non-traceable author [NAS]; X: expression pattern [IEP]

