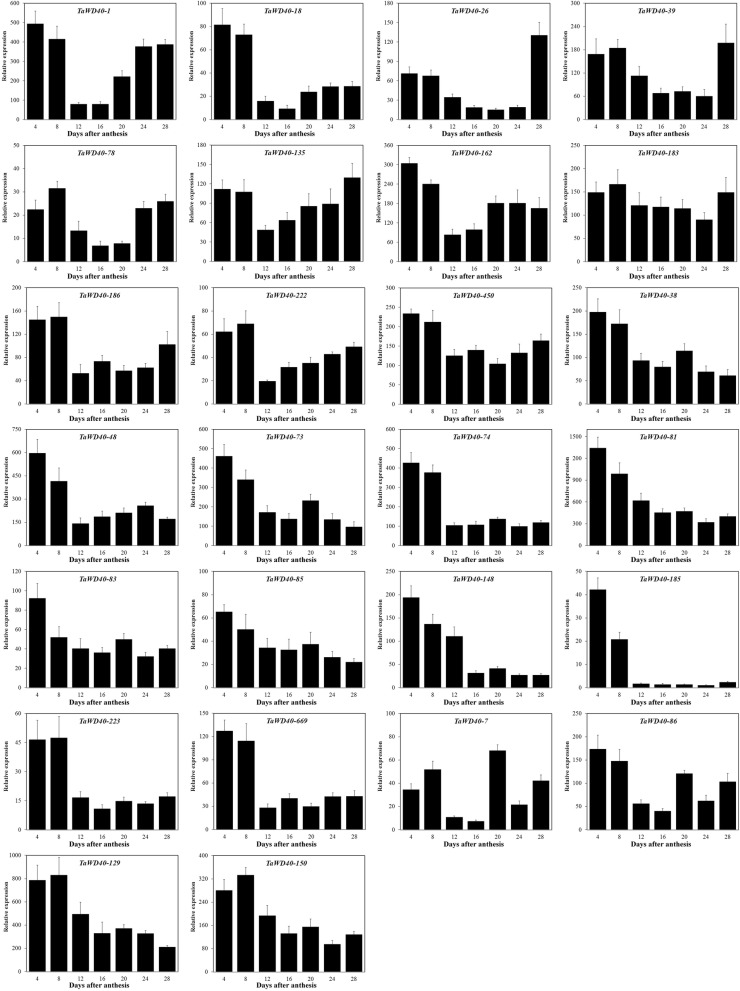
Fig. 5.
Expression profiles of 26 selected TaWD40s in the seed development of T. aestivum L. cv. Chinese Spring. Y-axis, relative expression levels; X-axis, days after anthesis. The error bars represent standard deviation (S.D.) calculated from three replications. The gene expression levels are normalized to the internal control of TaActin

