Figure 3.
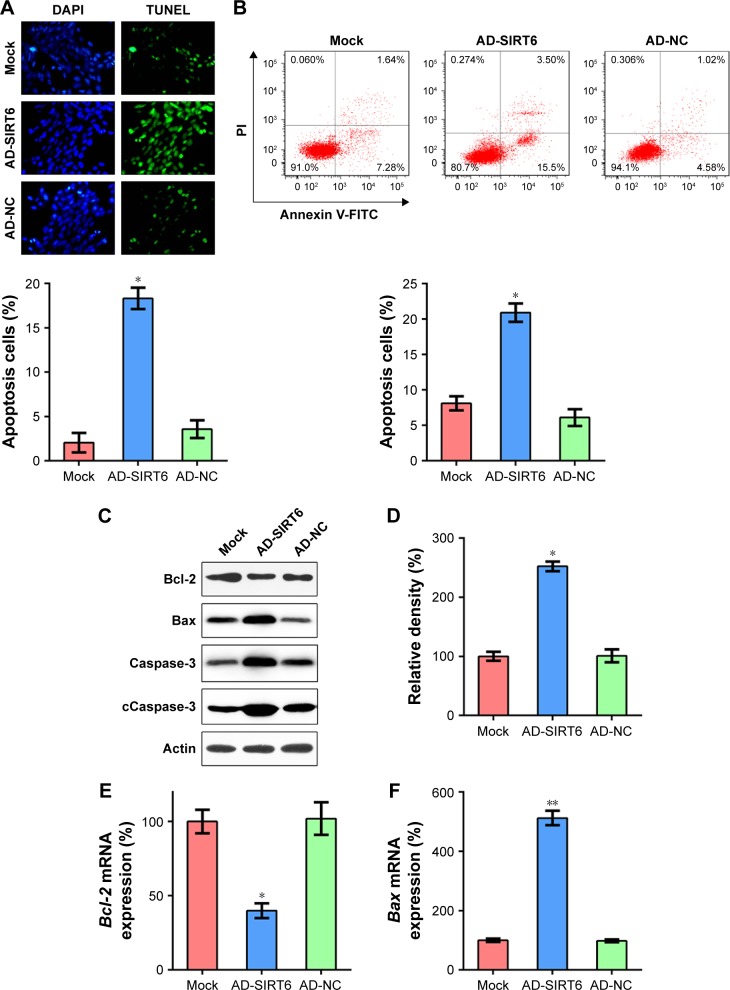
Overexpression of SIRT6 enhanced apoptosis of NPC cells.
Notes: (A) TUNEL assay was performed in each group of 5-8 F cells expressing SIRT6 or NCs. Magnification, 400×. The number of TUNEL-positive 5-8 F cells is displayed in the lower panel. (B) Annexin V-FITC/PI staining and flow cytometry were performed to evaluate the number of apoptotic cells. Early apoptotic cells are shown in the upper right quadrant of each plot, and later apoptotic cells are displayed in the lower right quadrant of each plot. Analysis of the apoptotic rate of 5-8 F cells in all groups is shown in the lower panel. (C) Expression levels of SIRT6-regulated Bcl-2 and Bax, total caspase-3, and cleavage of caspase-3 in the Hep-2 cells. (D) Relative density of cleaved caspase-3 bands. (E, F) qRT-PCR was performed to assess the influence of SIRT6 on mRNA levels of Bcl-2 and Bax. Data are shown as mean ± SD. *P<0.05, **P<0.01.
Abbreviations: AD, adenovirus; NC, negative control; NPC, nasopharyngeal carcinoma; PI, propidium iodide.

