Fig. 2.

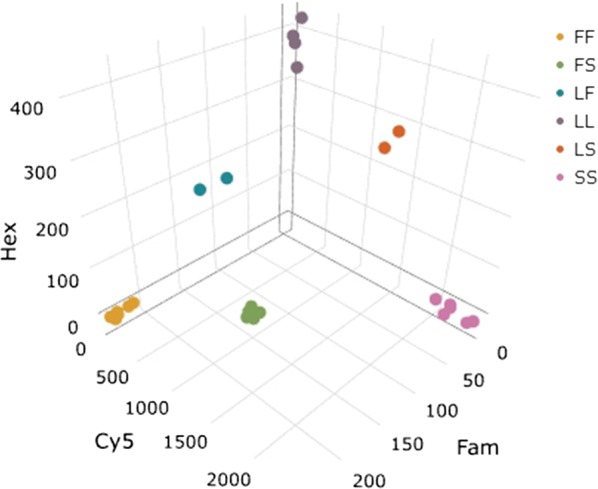
A 3D scatter plot showing distinct genotype groupings for kdr L1014 mutation as determined by the ΔR Last fluorescence of L1014L (Hex), L1014F (Fam) and L1014S (Cy5) probes in a single LNA-kdr assay

A 3D scatter plot showing distinct genotype groupings for kdr L1014 mutation as determined by the ΔR Last fluorescence of L1014L (Hex), L1014F (Fam) and L1014S (Cy5) probes in a single LNA-kdr assay