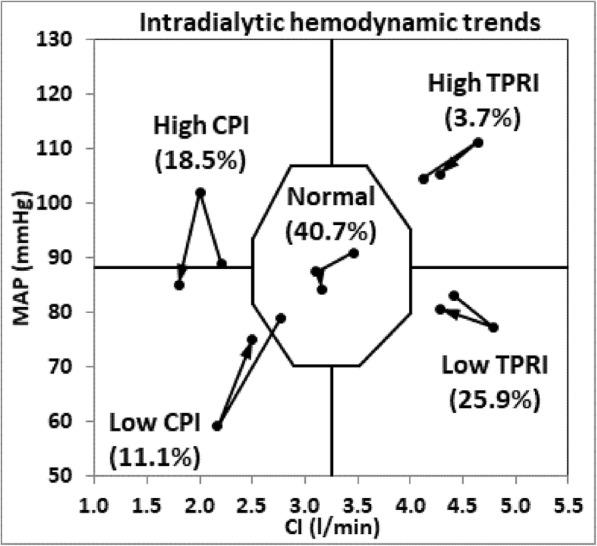
Fig. 2.

Hemodynamic changes from pretreatment to intradialytic extreme hemodynamic and to post-treatment of the 5 hemodynamic groups. Note: Hemodynamic changes from pretreatment to intradialytic extreme hemodynamic and to post-treatment (along the direction of arrows) using hemodynamic graphing of MAP vs CI. Normal range is illustrated by central octagon and defined as a region with BP between 70 and 105 mmHg, CI between 2.5–4.0 l/min/m2, CPI between 0.45–0.85 W/m2 and TPRI between 1600 and 3000 dyn*sec/cm*m2 Horizontal and vertical lines separate the 4 hemodynamic zones
