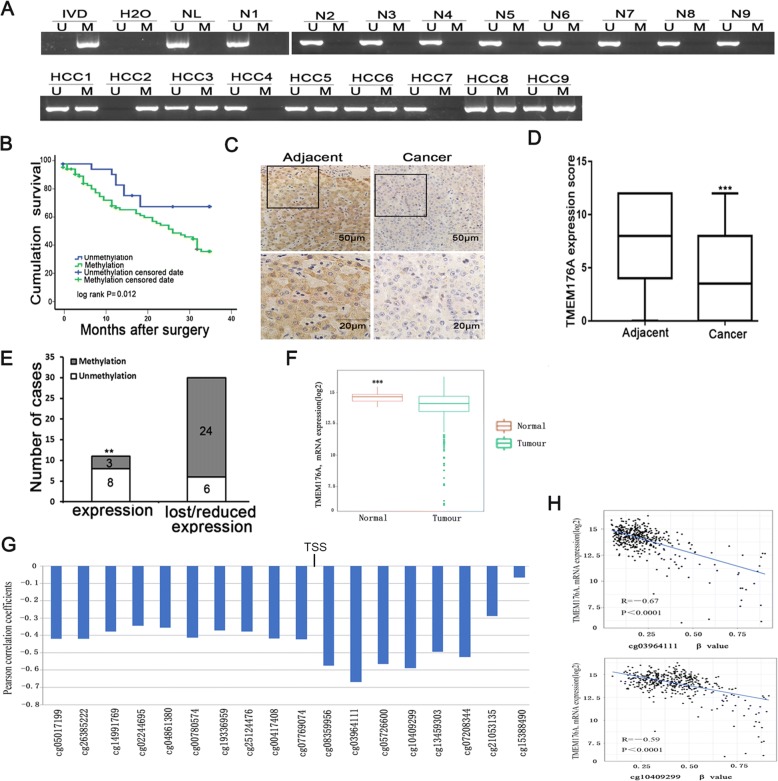
Fig. 2.
Expression and methylation status of TMEM176A in primary HCC. a Representative MSP results of TMEM176A in normal liver tissue samples and primary HCC samples. N: normal liver tissue samples; HCC: primary HCC samples. b The 3-year overall survival curves for patients in the methylated and unmethylated groups (P < 0.05). c Representative IHC results show TMEM176A expression in HCC tissue and adjacent tissue samples (top, × 200; bottom, × 400). d The expression of TMEM176A and DNA methylation status is shown as a bar diagram. Reduced expression of TMEM176A was significantly associated with promoter region hypermethylation. **P < 0.01. e TMEM176A expression scores are shown as box plots; horizontal lines represent the median score; the bottom and top of the boxes represent the 25th and 75th percentiles, respectively; vertical bars represent the range of data. Expression of TMEM176A was significantly different between adjacent tissue and HCC tissue in 41 matched HCC samples. ***P < 0.001. f TCGA data show TMEM176A mRNA expression levels in HCC tissues (n = 373) and normal liver tissues (n = 50) according to RNA-Seq results. Box plots, levels of TMEM176A expression. Horizontal lines, counts of log2 (TPM + 1). TPM: transcripts per million (reads). ***P < 0.001. g Pearson correlation coefficient between TMEM176A methylation and expression at each CpG site. h Scatter plots showing the methylation status of the 12th (cg03964111) and 14th (cg10409299) CpG sites, which are correlated with loss or reduced TMEM176A expression in 373 cases of HCC tissue samples. ***P < 0.001

