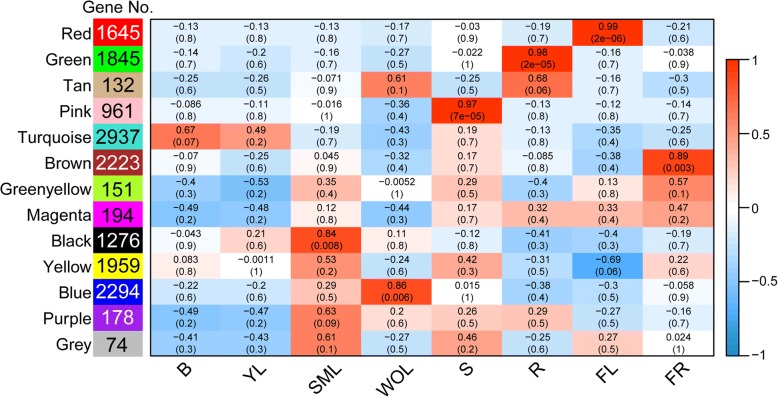
Fig. 2.
Co-expression network analysis. WGCNA analysis of AS genes in eight tissues. Each column corresponds to a specific tissue (B, bud; YL, young leaf; SML, summer mature leaf; WOL, winter old leaf; S, stem; R, root; FL, flower; FR, fruit). Each row corresponds to a module. The number of genes in each module is indicated on the left box. The color and number of each cell at the row-column intersection indicates the correlation coefficient between the module and the tissue type. A high degree of correlation between a specific module and the tissue type is indicated by dark red

