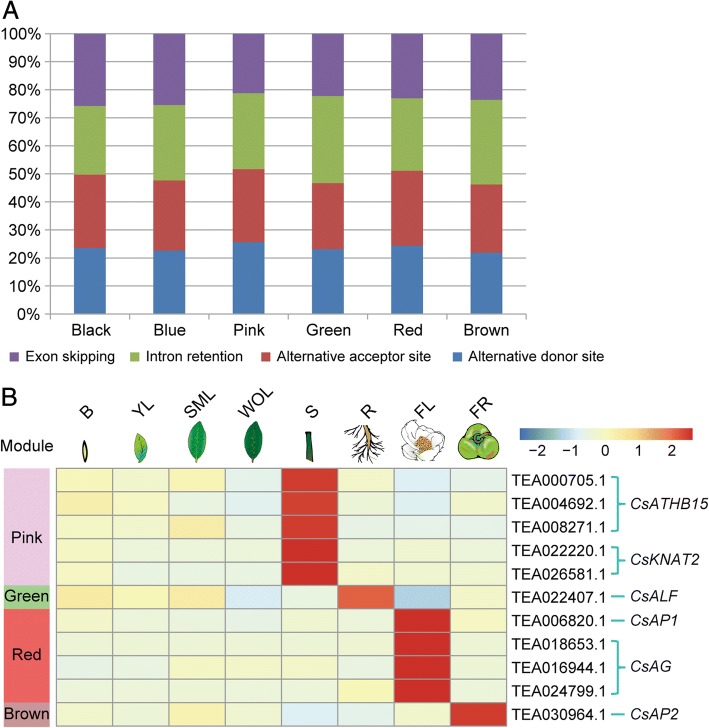
Fig. 3.
Characteristic analysis of tissue-specific AS genes. a Distribution of different types of alternative splicing events in eight tissues. b Heat map showing the transcript level in FPKM of each tissue-specific AS gene from the pink (stem) module, green (root) module, red (flower) module and brown (fruit), respectively. Red and blue colors represent high and low levels of transcript abundance, respectively

