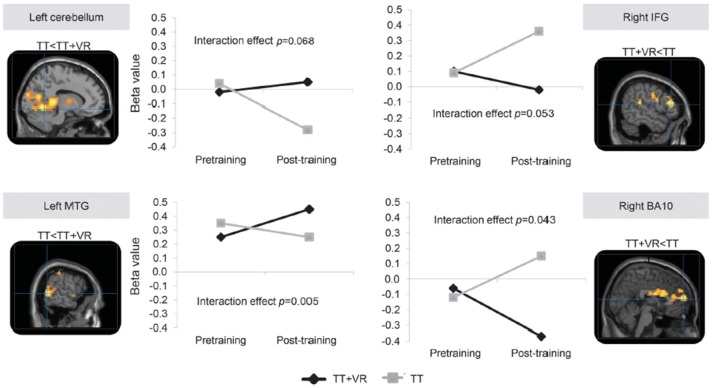
Figure 6.
fMRI data adapted from Maidan et al. (132). Training-specific differences in brain activation during obstacle negotiation after two interventions. The images present the 4 brain areas with different patterns of activation after training between the 2 training arms, while the corresponding graphs show the changes in mean β values for voxels in each of these 4 brain areas before and after training. P-values are from mixed model analyzes and represent the interaction between time (pre- vs. post-training) and training arm (treadmill training, TT vs. treadmill training with virtual reality, TT + VR). BA, Brodmann area; IFG, inferior frontal gyrus; MTG, middle temporal gyrus. Figure reproduced by permission of Wolters Kluwer Health Inc. (4386371208392).

