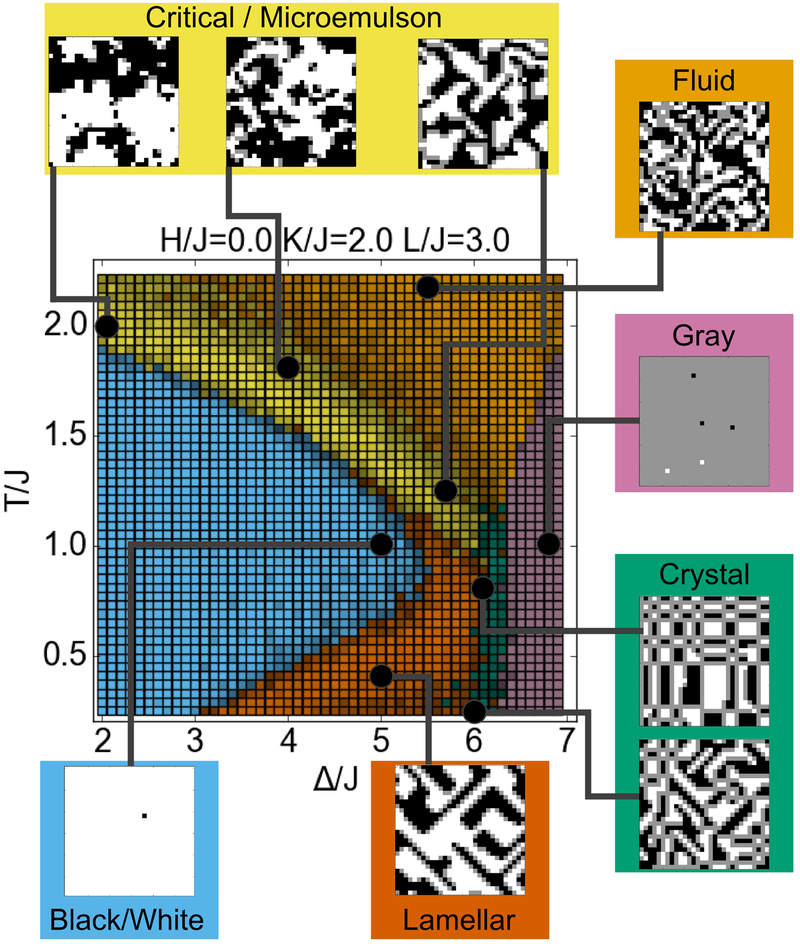
Figure 3.
Phase diagram of the lattice model. The color of each pixel with specified (Δ/J, T/J) coordinates indicates the phase at that point, as determined by the neural network. Pixels with a higher brightness indicate a higher level of confidence in the classification. Snapshots show typical examples of each of the phases, corresponding to the black points on the phase diagram.

