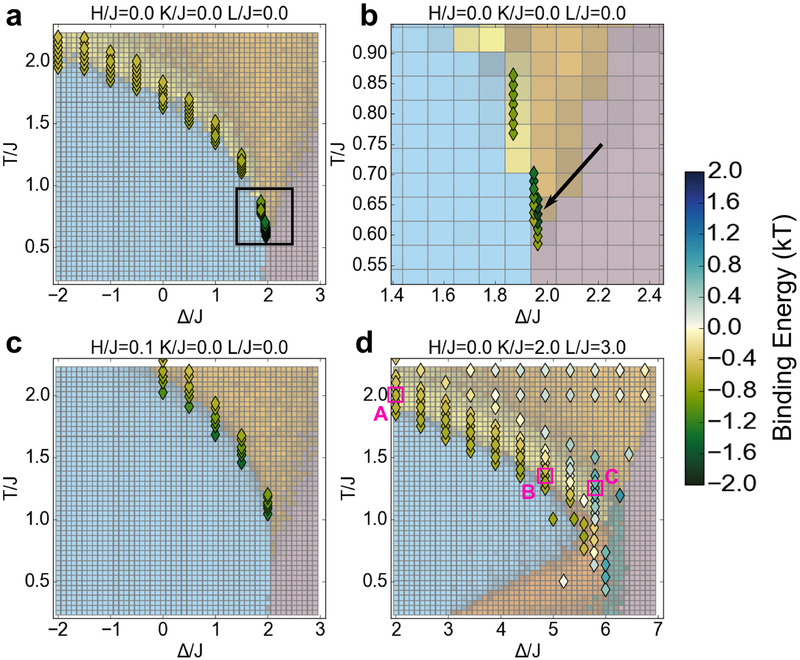
Figure 6.
Kinase binding energy at selected points in the phase diagram. Each colored diamond indicates the free energy change associated with moving a kinase into a cluster of receptors (as in Figure 2c) at that point (Δ/J, T/J) in the phase diagram. The phase diagram colors are rendered paler than in other figures to make the diamonds more clearly visible. (a) Binding energy in the Blume-Capel model (K=0, L=0) for the cross-section H=0. (b) Inset of (a) in the region around the tricritical point (black box in (a)). The indicated point (black arrow) with the minimum free energy of −1.7 kBT occurs at the tricritical Δ and 1.04 times the tricritical temperature. (c) Binding energy in the Blume-Capel model for the cross-section in which the external field H/J = 0.1 favors black pixels, opposite to the kinase and receptor preference for white pixels. (d) Binding energy in a cross-section that includes microemulsions and lamellar phases (K/J = 2, L/J = 3). Within the microemulsion/critical phase, marked points (magenta boxes) were analyzed with correlation functions and visual inspection of simulation snapshots (Figure S6). Point A is part of the critical “phase,” point B is a microemulsion with length scale ~ 10, and point C is a microemulsion with length scale ~ 4. At certain points in this cross-section (blue color scale), including point C, the positive binding energy indicates that it is energetically unfavorable to bring the kinase into the cluster.

