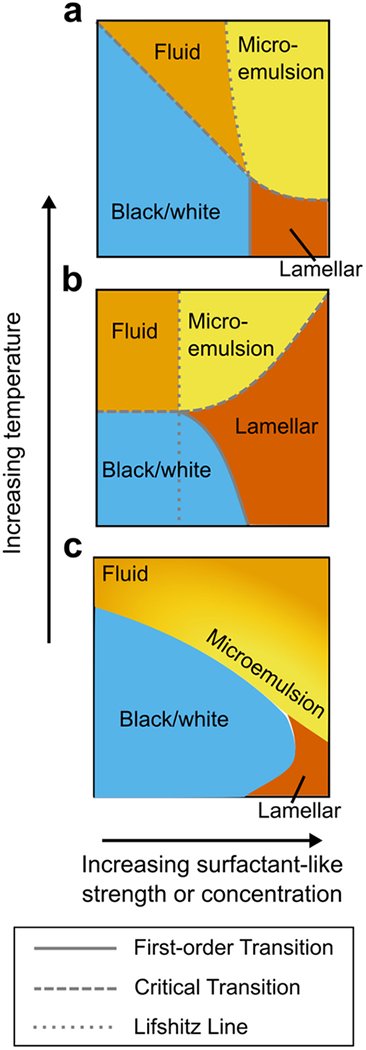
Figure 7.
Schematic comparison of our phase diagram with those from the microemulsion literature. (a) Mean-field phase diagram from a model with hybrid lipid species acting as a surfactant. Adapted from52 (b) Mean-field phase diagram from a model with curvature coupled to membrane composition to produce a surfactant-like interaction. Adapted from7. (c) Phase diagram generated by our neural network approach. X coordinate gives strength of surfactant-like interaction in (b), or concentration of surfactant species in (a) and (c). Y coordinate represents temperature. Note that this is a schematic representation, so the actual axes from the source papers differ in scale and representation. For the sake of comparison to the other models, we use yellow here to represent only microemulsions, not Ising critical behavior. The yellow-orange gradient in (c) is used to schematize the ambiguity between microemulsion and ordinary fluid phase, and represents our best interpretation of the location of the microemulsion state, taking into account the neural network output (Figure 3), snapshots within the phase diagram (Figure 3, yellow-bordered panels), and the location of the Lifshitz line from36 shown in Figure S9.

