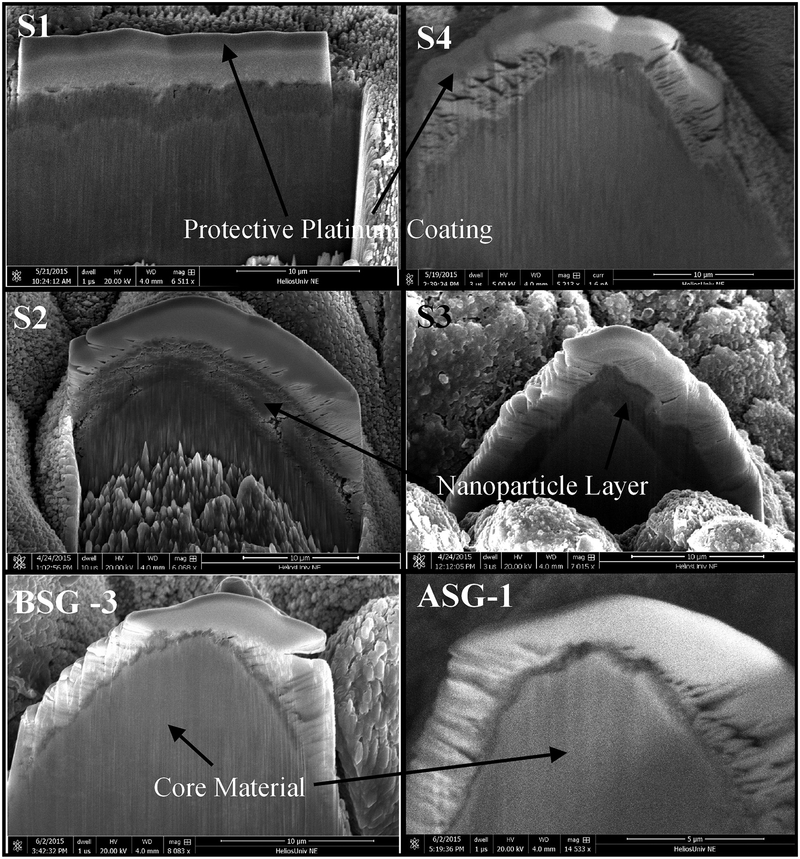
Fig. 4.
Images of cross sections for each of the samples in Fig. 3. In each image the white top layer corresponds to the platinum layer. Beneath the platinum is the nanoparticle layer (dark gray) and below the nanoparticle layer is the core material (light gray). Scale bars are 10 μm for all surfaces except ASG-1 which is 5 μm.

