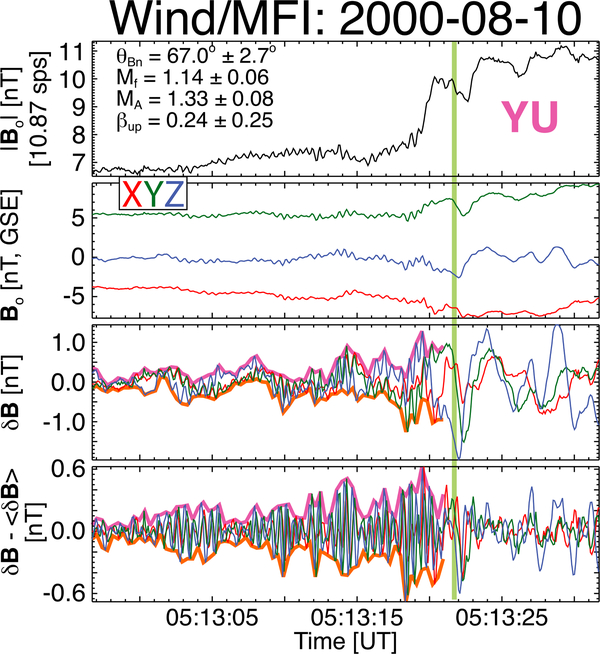
Figure 4.
Example interplanetary shock observed by the Wind spacecraft illustrating the use of the outer waveform envelope to parameterize the precursor amplitude statistics, (first and second panels) Same format as in Figure 1. (third panel) The high-pass filtered GSE components of Bo. (fourth panel) The same high-pass filtered data, but has been detrended—removed low-frequency contaminants using a 10 point boxcar averaging window—to isolate the precursor oscillations. The upper (magenta) and lower (orange) bounds of the outer waveform envelope are shown in Figures 4 (third panel) and 4 (fourth panel). The green vertical line denotes the separation between upstream (to left) and downstream (to right) regions.

