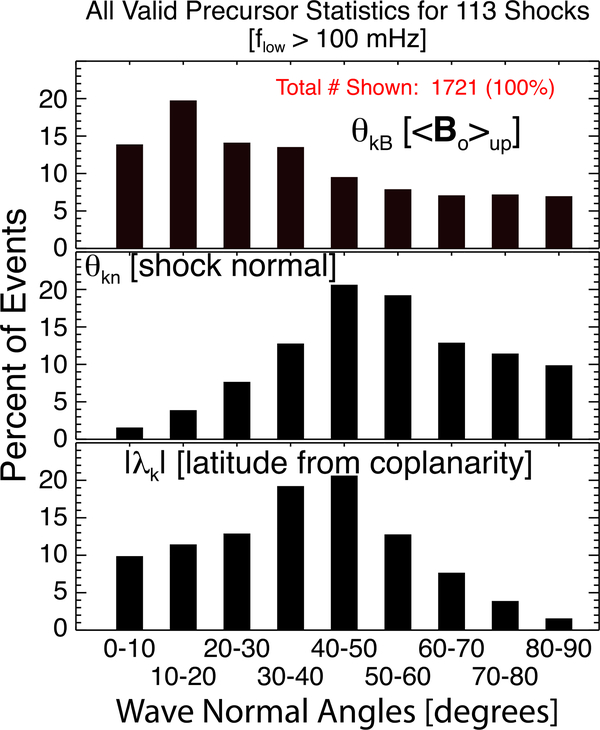
Figure 5.
Wave normal angle statistics for the best MVA subintervals examined for the 113 precursors. The histograms show the percentage of all results versus the angle bins, where the total number of MVA subintervals is shown in Figure 5 (top). The panels show, (top) the angle between and 〈Bo〉up (θkB), (middle) and (θkn), and (bottom) the magnitude of the latitude of from the coplanarity plane (|λk|).

