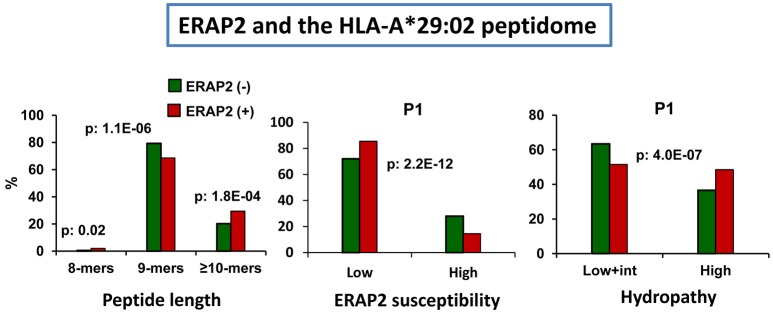
Figure 6.
Influence of ERAP2 on the A*29:02 peptidome. Comparison of the A*29:02 ligands over-represented (>1.5-fold) in the mock-transfected ERAP2-negative LCL PF97387 (PG-GFP, N: 839 peptides) expressing the Hap2/Hap3 variants of ERAP1 (green), with those (red) over-represented in the same ERAP2-transfected LCL (PF-ERAP2, N: 990 peptides). The comparisons involve peptide length distribution (left panel), joint frequencies of P1 residues showing low or intermediate+high susceptibility to ERAP2 trimming (middle panel) or showing low+intermediate or high hydropathy (right panel). The statistical significance of the changes is indicated by the p-values, as estimated by the χ2 test. These data were originally published in reference (93).

