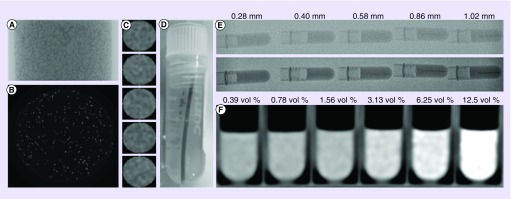
Figure 7. . Micro-computed tomography of homogeneous radiopaque bead phantoms.
(A) Single 2D projection; (B) slice through reconstructed data; and (C) column of individual beads (∼160 μm diameter). (D) Photograph of a line phantom of packed beads in tubes of specified diameter and embedded in agarose. (E) Images of line phantoms of different line (vessel) diameters under standard fluoroscopy (upper image) and high-resolution single shot (lower image). (F) Computed tomography of bead suspensions in agarose of different bead concentrations in order to gauge conspicuity under computed tomography and to predict streak artefacts.
Reproduced with permission from [28] © Ivyspring International (2016).

