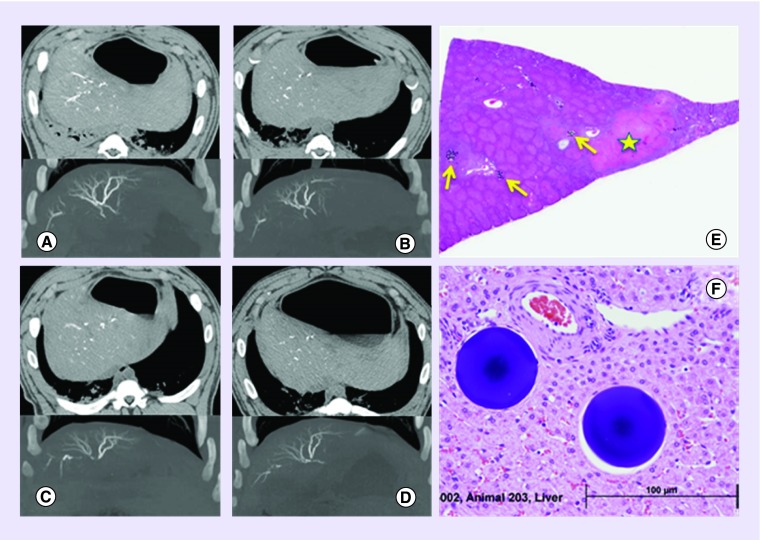
Figure 8. . Imaging and pathological appearance of radiopaque beads.
Longevity of the visibility of DC Bead LUMI™ observed with CT scan at 1 h, 7, 30 and 90 days postembolization (A–D, respectively). The top half of each image shows CT scans obtained without soluble intravenous contrast (axial plane and soft tissue windows) showing beads in the hepatic arteries. The lower half of each image shows maximum intensity projection images from CT scans obtained with soluble intravenous contrast (coronal plane and bone windows) showing more clearly the beads packed together along the lengths of hepatic arterial vessels. (E) Pathology of the liver at day 1 postembolization showing the presence of bead clusters (yellow arrows) and areas of focal coagulative necrosis and fibrosis (yellow star). (F) Integration of the beads into the remodeled hepatic tissue at day 90 with no associated long-term foreign body response.
Reproduced with permission from [87] © Elsevier (2016).

