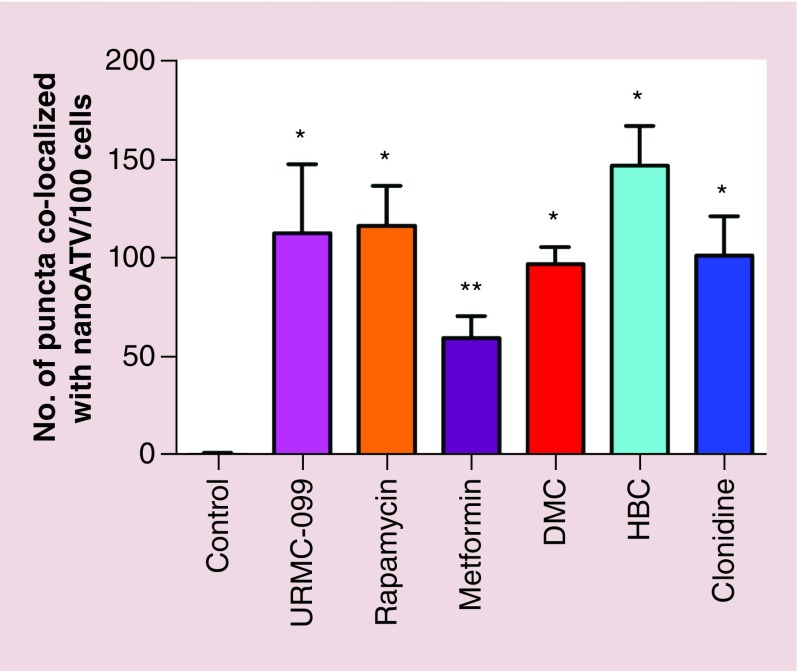
Figure 5. . Quantitative measurement of white puncta by light chain 3 ß antiretroviral colocalization.
Multiple comparisons between control and the means of each sample was done using the Tukey's multiple comparison ANOVA test. Data are represented as mean ± SD for n = 5 per group. *p < 0.0001 and **p< 0.001.
SD: Standard deviation.

