
Figure 2. Tissue-associated variation in chromatin accessibility is concentrated at TSS-distal regions.
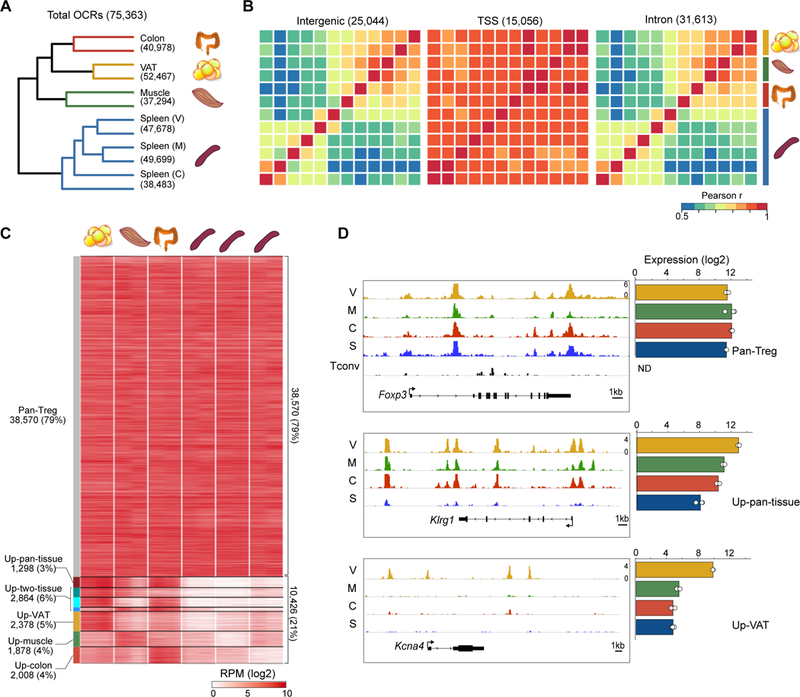
(A) Hierarchical clustering of Tregs by their pair-wise Pearson correlation values for all 75,363 OCRs. (B) Heatmaps of Pearson pair-wise correlation scores for Treg OCRs located within various functional genomic elements. Treg populations were clustered as in A, with the color bar at right demarcating biological replicates. (C) Classification of OCRs. Those OCRs with ATAC signal ≥ 3-fold higher in each non-lymphoid-tissue:splenic Treg pairing were clustered by whether their “up” status was shared across all three, two, or only one non-lymphoid tissue. Pan-Treg OCRs were not differentially accessible in any of the pairings. Heatmap shows the ATAC signal (in reads per million) in different OCR classes. (D) ATAC-seq reads (left) for example genes whose OCR patterns matched their mRNA expression patterns (right) across the Treg subsets. The Tconv track shows minimal accessibility at Foxp3 in non-Treg CD4+ splenic T cells.