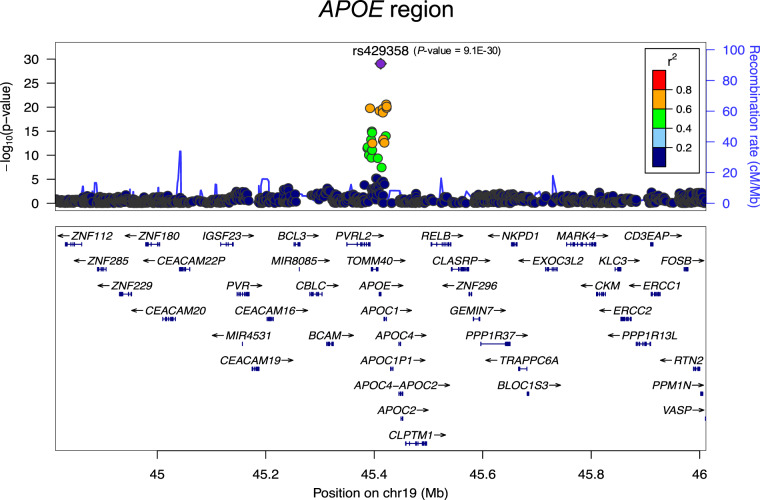
Fig. 3.
Regional plot of the APOE region on chromosome 19 in the meta-analysis. The relative location of genes and the direction of transcription are shown in the lower portion of the figure, and the chromosomal position is shown on the x -axis. The light blue line shows the recombination rate across the region (right y -axis) and the left y-axis shows the significance of the associations. The purple diamond shows the P-value for rs429358 that is the most significant SNP in the meta-analysis. The circles show the P-values for all other SNPs and are color coded according to the level of LD with rs429358 in the 1000 Genome Project EUR population

