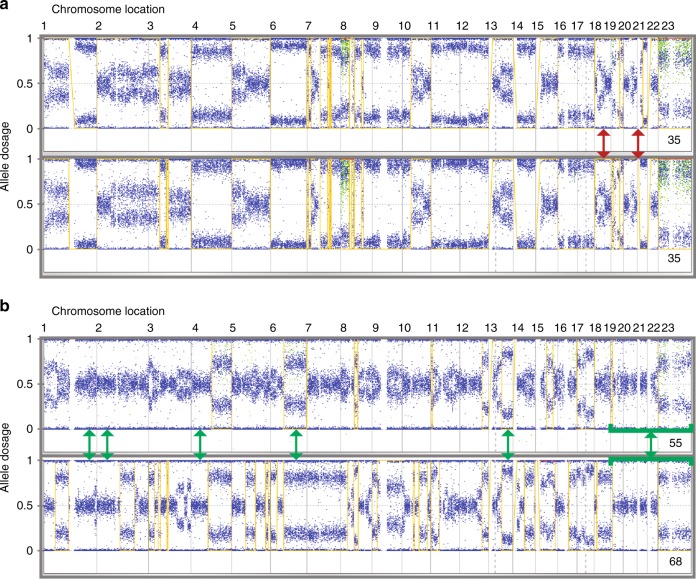
Fig. 2.
Genomic profiles of primary and recurrent tumour samples with low and high HRD. Examples are shown for tumours with similar (a) and very divergent (b) primary and recurrent pairs. The yellow line indicates regions of LOH (allele dosage of 0) and non-LOH (allele dosage of 1). Areas of divergence (red arrows) and similarity (green arrows) are indicated. HRD scores are in the bottom right of each profile

