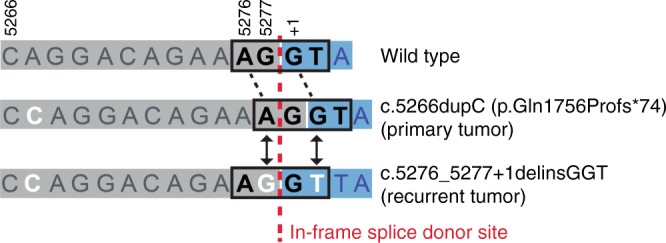
Fig. 3.

Schematic illustration of BRCA1 reversion mutation. Alignment of sequences of a region in wild-type BRCA1, mutated BRCA1 in the primary tumour, and reversion BRCA1 mutant in the recurrent tumour. The mutated bases are shown in white. Exonic sequence is shaded in grey and intronic sequence is shaded in blue. The splice donor site bases are shown by the boxed region on each sequence. The vertical red line indicates the position in the sequence where the in-frame splice donor site would be located. The numbers above the wild-type sequence read indicate the codon position within the wild-type transcript. The second line shows the sequence observed in the primary tumour. The third line shows the sequence observed in the recurrent tumour
