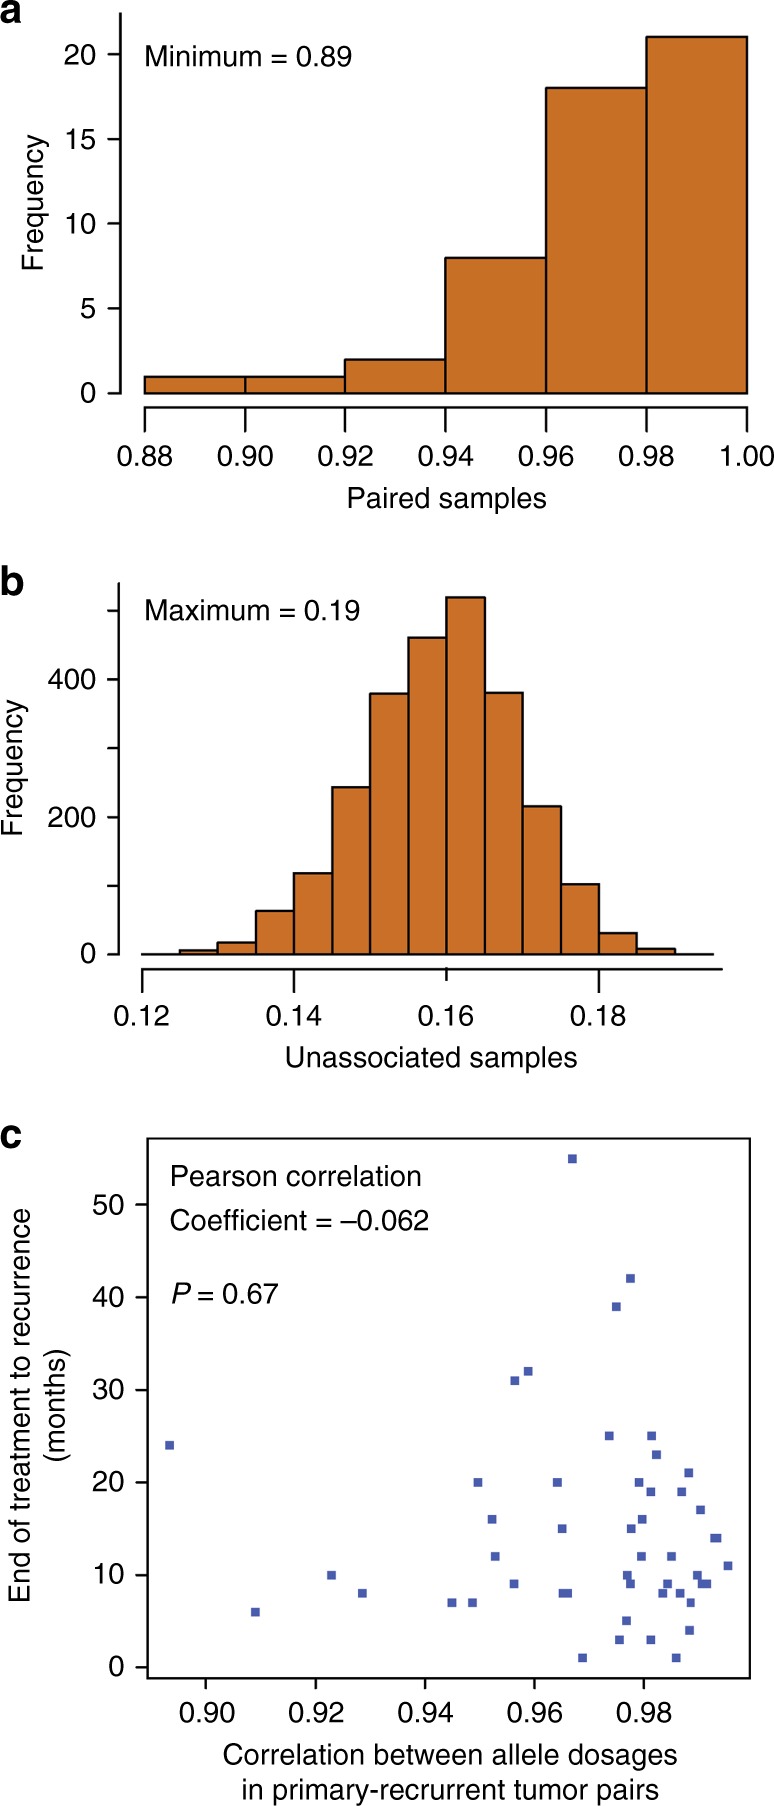
Fig. 4.

a Correlations between allele dosages in primary-recurrent tumour pairs. The histogram represents the frequency of Pearson’s correlation coefficients between paired allele dosages for matched primary-recurrent tumour pairs. b Correlations between unrelated primary and recurrent tumour samples. The histogram represents the frequency of Pearson’s correlation coefficients between paired allele dosages for unrelated primary-recurrent tumour pairs. c association between time to first recurrence and change in genomic profile. The scatter plot shows the relationship between Pearson’s correlation coefficients between allele dosage in matched primary-recurrent tumour pairs and time from end of treatment to first recurrence in months
