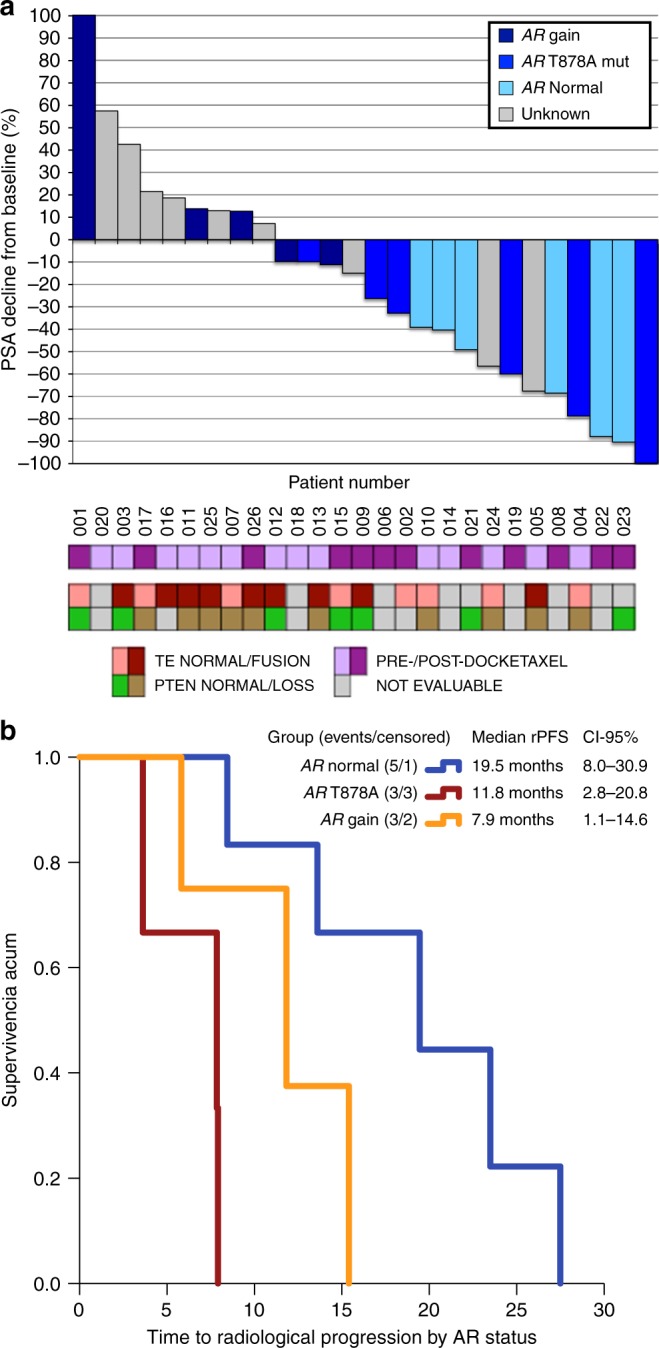
Fig. 4.

a Waterfall plot representing PSA best response according to PCWG2 criteria (y-axis) and patients (x-axis). Each individual bar represents a patient, ordered by the magnitude of PSA response. Patients’ ID at the bottom match those in Fig. 1 (swimmer-plot). Each bar is coloured according to AR status determined in ctDNA: navy-blue for AR gain, medium-blue for AR T878A mutation, sky-blue for AR normal, grey for unknown status due to lack of sample available, or low cfDNA isolated. Panel at the bottom summarises pre- or post-docetaxel status, TMPRSS2-ERG (TE) fusion and PTEN status in available archived diagnostic biopsies/prostatectomy. b Kaplan–Meier radiographic progression-free survival (rPFS) curves according to AR status in ctDNA: blue represents patients with AR normal status, orange for patients harbouring an AR T878A mutation, and red for patients with AR gain detected, respectively. Exploratory long rank-test suggests that rPFS is significantly prolonged in AR normal compared with AR gain (p = 0.002). The differences observed between AR normal and AR T878A (p = 0.117) or AR T878A and AR gain (p = 0.092) were not significant
