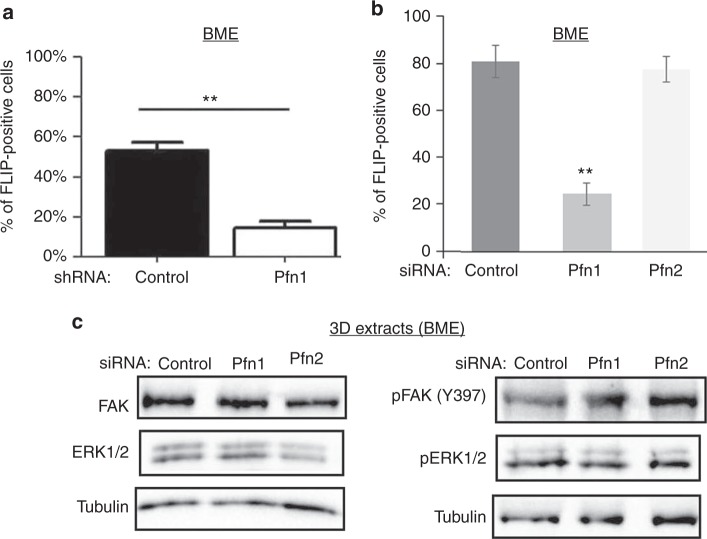
Fig. 3.
Effect of Pfn1 depletion on FLP formation, FAK, and ERK activation in MDA-231 cells. a Bar graph summarizing % FLP-positive cells in control- vs Pfn1-shRNA groups of cells in 3D BME-MoT assay. b Bar graph summarizing the changes in % FLP-positive cells upon isoform-specific depletion of Pfn by respective siRNA transfection. All FLP data are based on analyses of >60 cells in each group pooled from two independent experiments for each experimental setting; **p < 0.01). c Representative Immunoblot analyses of FAK, pFAK (Y397), ERK1/2, and pERK1/2 from 3D BME-MoT extracts of MDA-231 cells transfected with the indicated siRNAs (tubulin blot—loading control). Values are presented as mean ± SD

