Fig. 6.
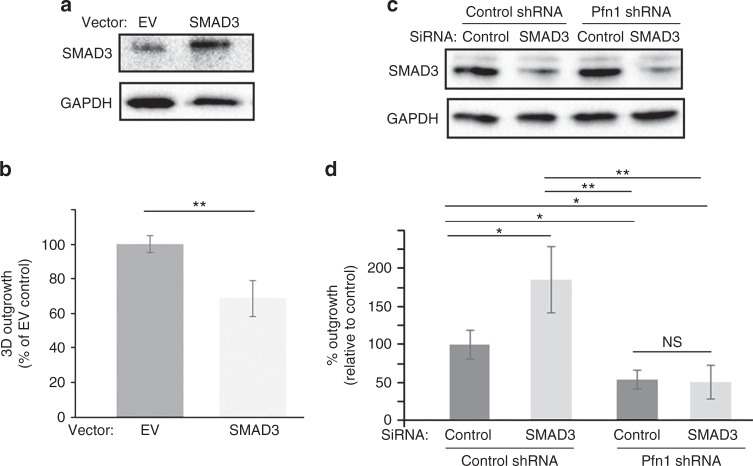
Effects of perturbation of SMAD3 on 3D outgrowth of MDA-231 cells in BME matrix. a–b a: SMAD3 and GAPDH (loading control) immunoblots of MDA-231 cells transfected with either empty vector (EV) control or SMAD3 overexpression vector (cells were transfected with 1 µg plasmid in 35 mm culture dish). Note that the SMAD3 immunoblot image was acquired at a very low exposure to avoid signal saturation of the overexpression band. b Summarises the outgrowth of SMAD3 overexpression group relative to EV control group of cells in BME matrix. c–d c: SMAD3 and GAPDH (loading control) immunoblots of total cell extracts of control and Pfn1-shRNA expressing MDA-231 cells transiently transfected with the indicated siRNAs. d Summarises the outgrowth of the various transfected groups relative to the control group (control shRNA expressers transfected with control siRNA) in BME matrix. Gene silencing and overexpression-based outgrowth data summarised from two independent experiments, with three technical replicates per experiment). *p < 0.05; **p < 0.01; NS not significant). Values are presented as mean ± SD

